Chrome DevTools has always been an essential feature in Sauce Labs for live testing real devices. It allows users to inspect web pages in Android devices and use Chrome DevTools to debug issues.
Background
In 2016, we launched a Chrome DevTools application to our customers that enabled them to debug webpages in Chrome and Safari in Android and iOS devices respectively. We used the static assets provided by the Chromium team and cloned the whole repository of artifacts in our product from their git source to render the DevTools UI. Some other browsers which use the Chromium DevTools protocol were also integrated with some limitations.
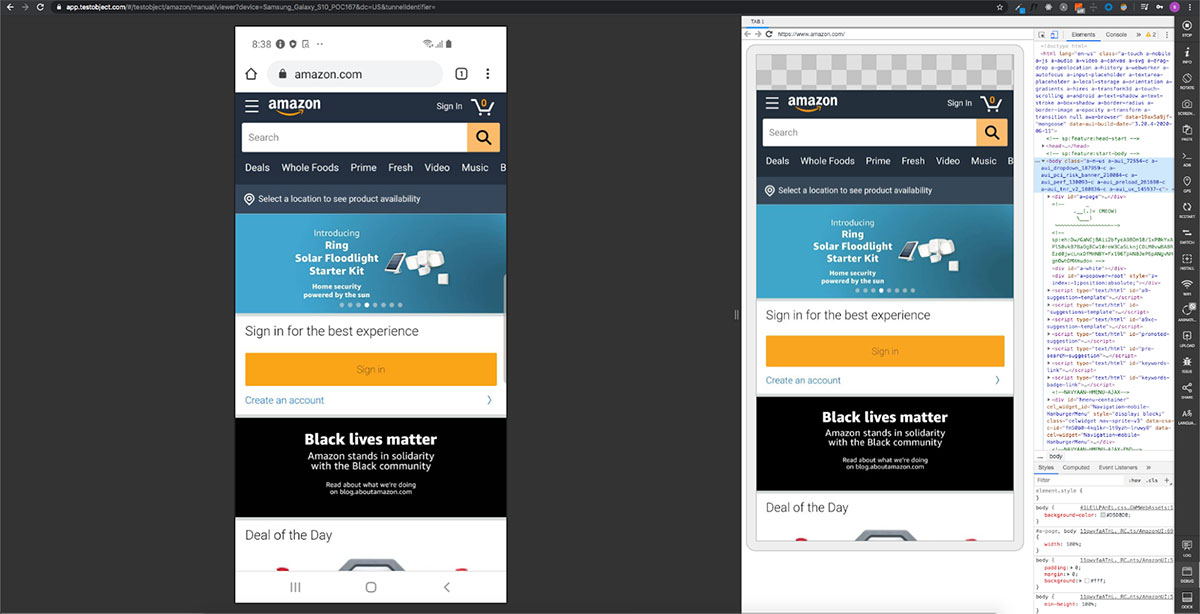
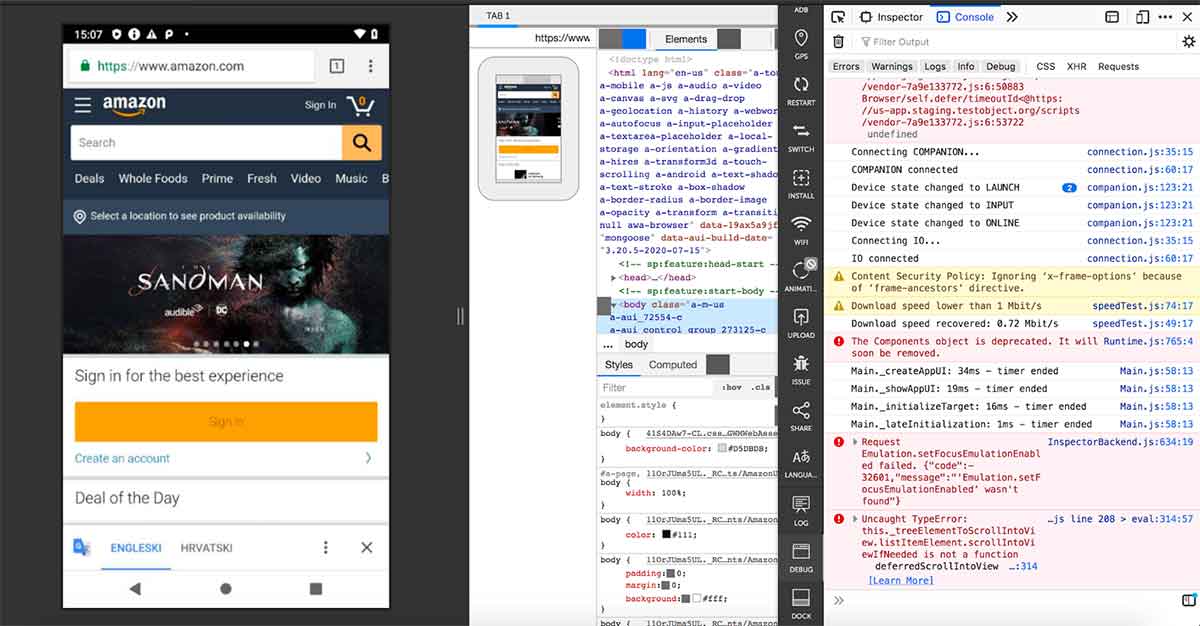
Here is a screenshot of a live testing session debugging Chrome on Android.
In late 2019, we started seeing some serious issues in the Chrome DevTools feature, as some browser APIs were deprecated. The Chromium team rolled out those changes in early 2019 as they migrated all of the DevTools UI to web components, which helped in maintaining the huge codebase and improving their developer experience with more generic guidelines. This article DevTools architecture refresh: migrating to Web Components entails more details on it. The problem was bigger than it seemed to be initially.
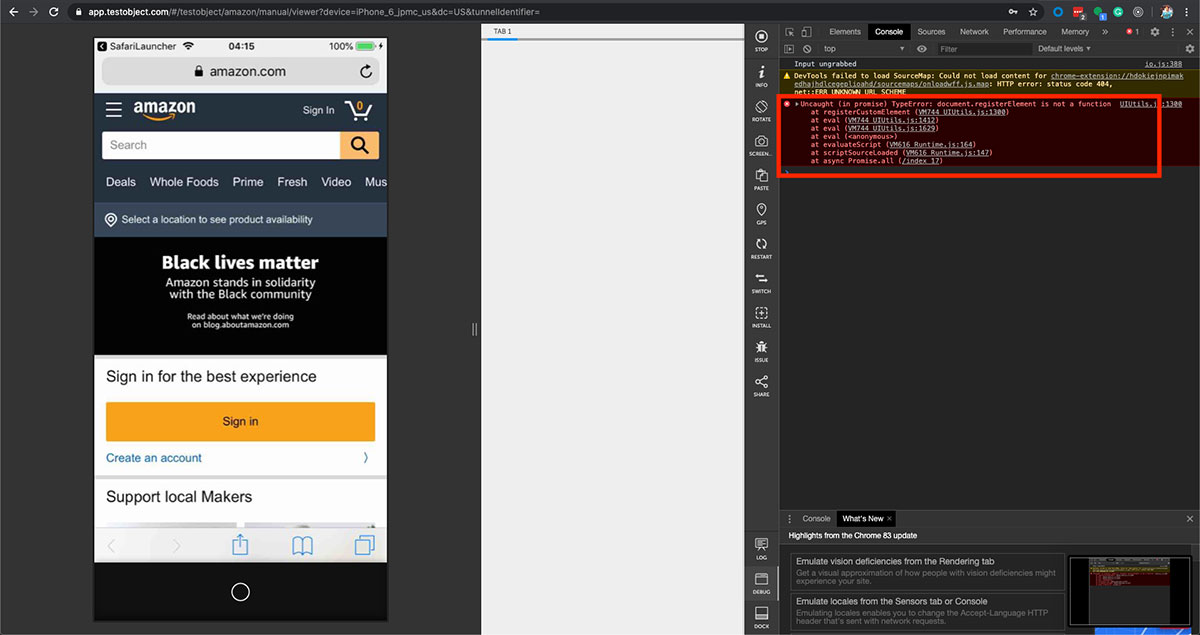
As you can see the error in the image below: document.registerElement is not a function so this issue we encountered in the beginning.
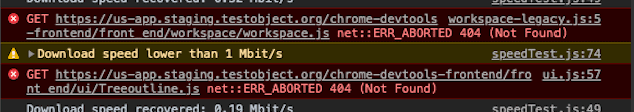
First we tried to replace the deprecated APIs from the Chrome DevTools library code, but it was a cumbersome task as changes were massive and code is oriented as library code so we went for other approaches.
Consideration we made to solve this issue
The first thought that stirred our mind was to upgrade to the latest version of DevTools Frontend. After upgrading to the new version, we encountered few more issues. Case in point:
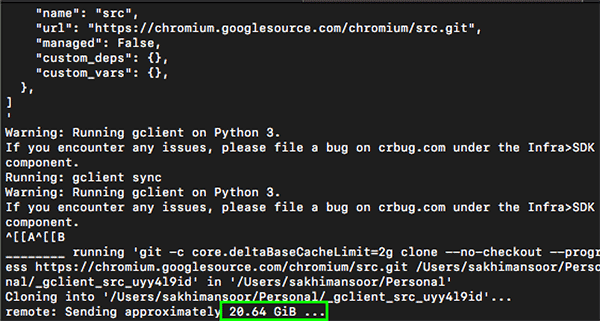
A few files were missing to render the DevTools UI. After digging into it further we found out that over the years the Chromium team has changed their build setup to compile Chrome DevTools frontend with some build script so assets are now generated on runtime. To build any Chromium project, you need to set up around 20GBs (as you can see in the image below). It was a somewhat complicated solution inclined more towards building a DevTools application instead of just using it, which didn’t sound like a suitable fix at that point since it was affecting our customers on production.
A Short Fix
We made the choice to go for a short term fix initially to add missing artifacts. After getting familiar with similar issues on Chromium Google source issues portal, we found a way to fetch generated artifacts on runtime with chromium hosted repo for static assets like this:
https://chrome-devtools-frontend.appspot.com/serve_file/@f34bc3521507d3a2b58ad8ce5e63c2a7c13ff3b9/InspectorBackendCommands.js >
(The format is@followed by the Chromium git commit hash; the parameter in the path is the file name)
With this hosted service we were able to retrieve missing artifacts and Chrome DevTools was back to life.
Fixing that particular API issue wasn’t our only focus for this problem. As this issue began to happen, we got some insights about our product, including some serious improvements we need to make this feature more robust.
An Intermediate Solution
After this solution we began to see how we can make it a more flexible, reusable and scalable solution that would thank our future selves. With some more research we looked into Chromium Depot tools provided by the Chromium team to build any of their projects independently from your Chromium setup. This setup was easy and reliable as we were able to compile the DevTools frontend on our own and generated all required artifacts which were around 250MBs (a less complicated solution than having 20Gbs set up).
We again put all those artifacts in our product repository and shipped to the customers. It started working fine but it wasn’t as scalable as we wanted it to be. At Sauce Labs we are migrating all features from our legacy codebase to a new React web app, and we needed the same solution for this feature. Here the real journey began — this is where we started thinking we should have a more reliable solution.
Long Term Solution
The previous solution wasn’t feasible in terms of developer experience since it had some constraints: In order to build all DevTools artifacts you need to have depot tools and DevTools Frontend git source on the same machine as it requires some symlinks. We didn’t want all of our developers to install these dependencies in their machines to make further needed changes to the DevTools feature.
Motivation: At Sauce Labs, we strive to keep a sustained balance in both developer and user experience. Our goal was to craft this feature in a way which just not only benefits us but helps the community in a certain way. As we have seen in this quest to solve this issue, there are no suitable options for the open source community to consume DevTools UI easily integratable in their project. All available options are a bit dispersed in small parts as Chrome DevTools UI isn’t commonly used as a standalone application so we decided to create such a solution. Also, we didn’t want to replicate and manage the same code in our different projects.
After some useful discussions within our teams and even talking to the Chrome DevTools Team we reached the conclusion that we needed to build a completely independent webapp for DevTools UI, which can be later integrated in our projects and OSS can leverage it somehow.
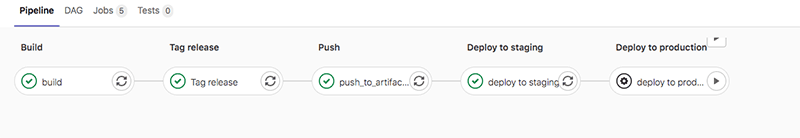
The final solution was crafted with the help of a bunch of tools we use at Sauce Labs: A Gitlab project consisting of several build scripts like fetching required dependencies to compile DevTool UI and keeping the built artifacts in gitlab to be used in our CI/CD pipelines later.
Here is an excerpt of one of our recipes to compile artifacts. In the first part, this script fetches depot tools and then clones the DevTools frontend repository. In the second part, it generated all the required artifacts that are needed to serve Chrome DevTools UI:
#!/bin/bash

## cloning scripts by Chromium to build chrome devtools ui
git clone https://chromium.googlesource.com/chromium/tools/depot_tools.git
export PATH="$PATH:$(pwd)/depot_tools"
mkdir devtools && cd devtools
fetch devtools-frontend
cd devtools-frontend

## building artifacts
gn gen out/Default
autoninja -C out/Default
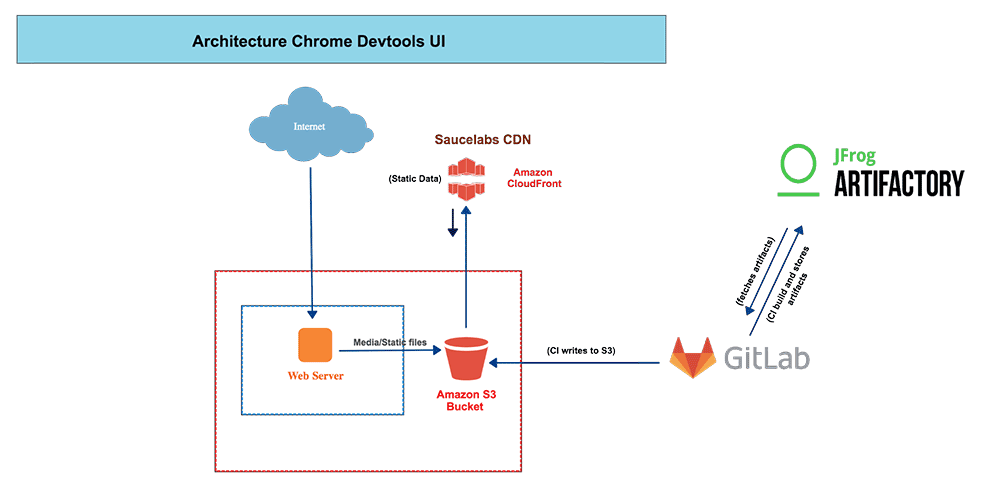
All artifacts are stored in JFROG Artifactory with proper versioning as the Chromium team doesn’t have any versioning scheme for it. This is quite helpful in order to roll back to a specific version. The final step is to push stored artifacts in dedicated AWS S3 buckets for DevTools UI artifacts in different data centres to alleviate latency issues to our customers over dedicated Cloudfront Distributions. A checksum technique is applied in order to speed up our CI/CD to use artifacts within Gitlab (stored in the first stage) instead of fetching from our artifactory repository and push to S3 bucket.
The best part of this solution is to ship changes to customers within a few clicks in the CI/CD.
Here we have an overview of the architecture:
Final Step: To integrate this UI into any webapp, all you need is pass your WebSocket debug URL of a webpage as a query param to establish connection between DevTools and your application.
https://da38tdtjguzrq.cloudfront.net/inspector.html?wss=${webSocketUrl}
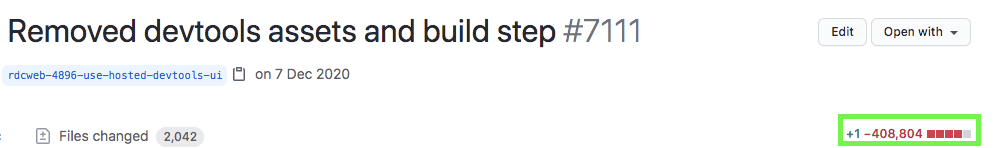
We configured those CDNs in our legacy and React application and saved storage resources from our repositories around 2GBs since the bespoke Chrome DevTools UI codebase and compiled artifacts were in the repository.
Indeed, we learned throughout this journey how open communication within a company helps to have more resilient and robust solutions. It was an effort with the collaboration of different teams at Sauce Labs. Our short term and intermediate solutions helped us in giving some bandwidth to spend more time for this solution. This just didn’t fix our problems, but also opened doors of opportunities for the OSS community. We are thankful to all of those who contributed to make this work and will be looking forward to the community if they can leverage it in their projects. The next subsequent blog will be focused on how we can integrate DevTools UI in an independent project.
Thanks for reading and feel free to share and reach out if you have any questions.