A HAR file contains requests tracking information between a web browser and a website. It can be used to identify website performance issues like slow page loads, missing content, wrong file formats, cross-domain request issues, authentication issues and much more.
There are some legacy tools like janodvarko/harviewer available to visualize HAR files but they have some limitations and are not actively maintained anymore. Therefore it’s hard to add new features like filters, a search or show requests body payload. Here at Sauce Labs we also wanted to achieve synchronisation between the HAR file items and the video and WebDriver commands.
To take advantage of HAR file information and provide a modern UI to visualize them, we have implemented a library called Network Viewer which is an open source library that is built with React.js. It is flexible enough to add many new features in the future.
HAR File Introduction
HAR is an abbreviation of HTTP Archive Format which contains information records about each network operation, including detailed timing data, HTTP request and response headers, cookies, and more.
How to generate a HAR file
Open DevTools To open the developer console in Google Chrome, open the Chrome Menu in the upper right hand corner of the browser window and select More Tools > Developer Tools. You can also use the shortcut Option + ⌘ + I (on macOS), or Shift + CTRL + I (on Windows/Linux).
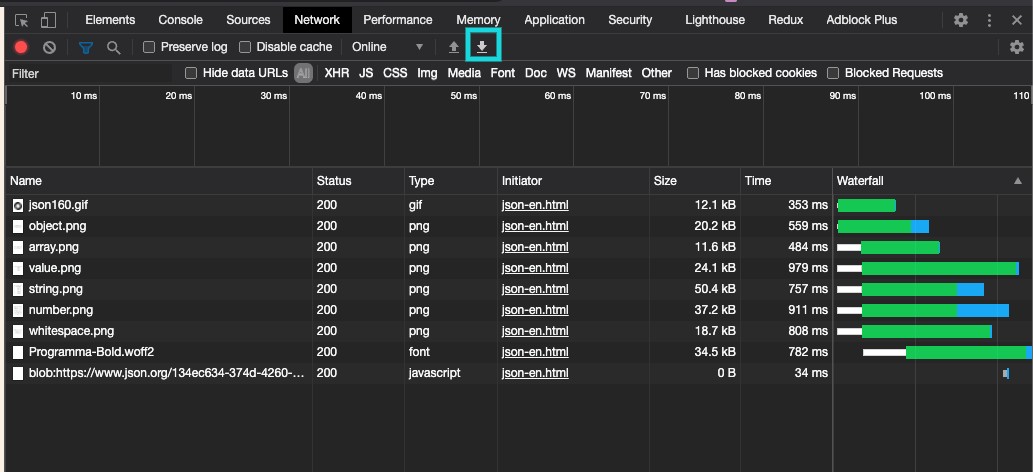
Select Network Tab Select the network tab from the top navigation bar of devtool.
Export HAR File If the network tab is empty reload the website to capture all the requests and then click on the export button to download the .har file. As an example, check the following screenshot of Chrome DevTools.
Browser Most of the modern browsers like Chrome, Firefox, or Safari have built-in DevTools available. Open DevTools in your favourite browser then click on the network tab and click on the export button to download the HAR file of the current website.
Sauce Labs
Use extendedDebugging: true capability while running automated tests. It will generate the HAR file of all the visited websites within the test suite. This feature is available in Chrome and Firefox.
Network Viewer introduction
Network Viewer is a visualization tool for HAR files, which displays a list of requests in table view with many advanced filters. It is built using React and its design is inspired by Chrome DevTools network viewer.
Features
Import/Upload HAR file
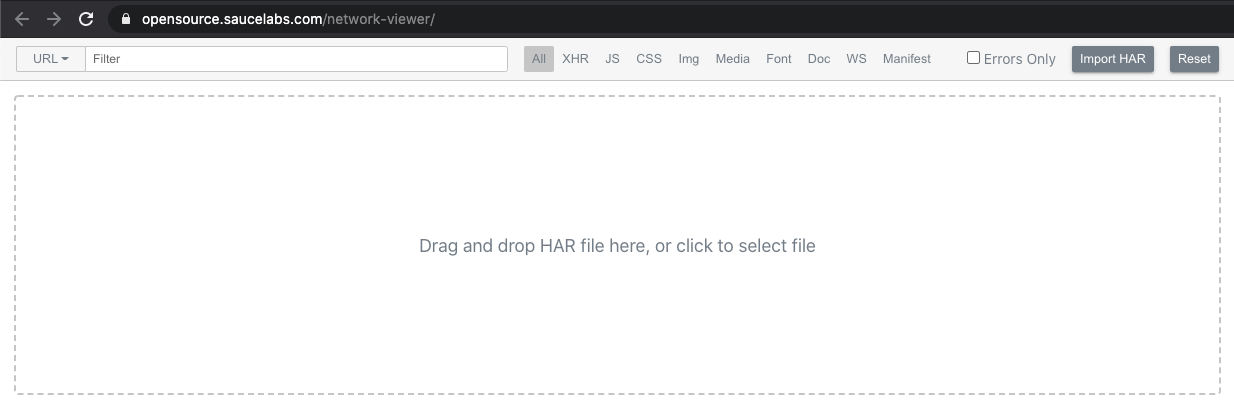
Upload or Import local HAR file to network-viewer either by drag and drop in component or by selecting file feature.
Fetch a HAR file using a query parameters (CORS support)
file and isCORSEnabled query string parameters can be used to fetch any remote HAR file. URL format can be like this https://opensource.saucelabs.com/network-viewer/?file={HAR_FILE_URL}&isCORSEnabled={true/false} UI is also available on the home page to help you with this feature.
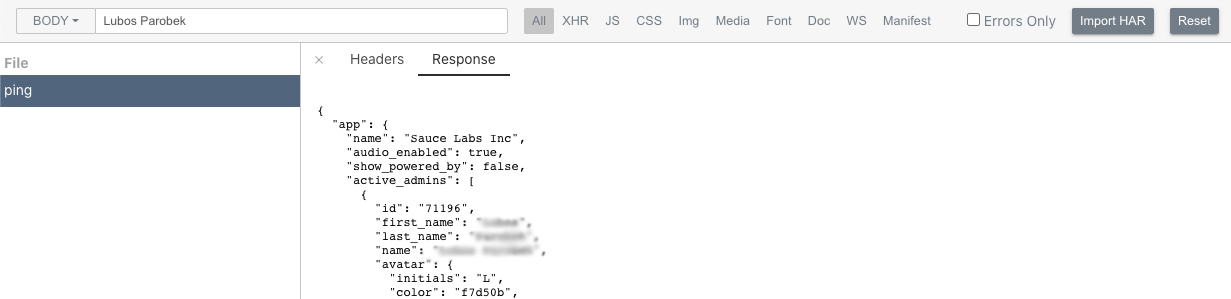
Search request by URL or body content
URL or body content of the request can be searched using a search input box.
Filter Requests
Requests can be filtered by content type (e.g. XHR, JS, CSS, Image, Media, Font, Doc, WebSocket, Manifest) using filter options.
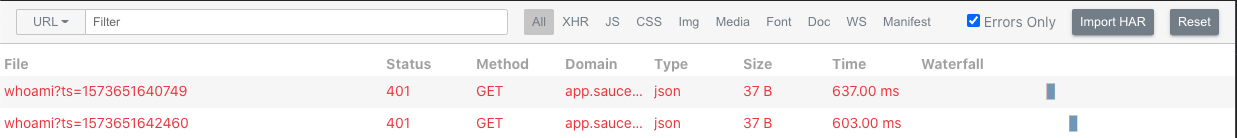
Errors Only filter
This checkbox helps to filter requests by status code where status code is greater than or equal to 400.
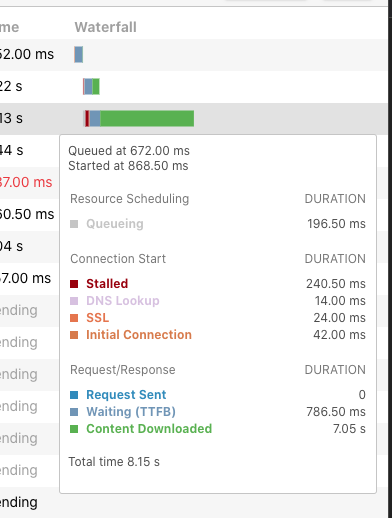
Waterfall chart
Waterfall chart displays the timeline of the request. Request timeline detail is available on mouse-over of waterfall chart. It is useful to understand the request time in depth.
Stats Row
Stats row in the footer displays a number of requests, transferred data size, resources size, and time metrics like Page Load, DOMContentLoaded and Finished Time.

Request Detail
Request detail is available on click of request, response content is available for JSON and XML responses.
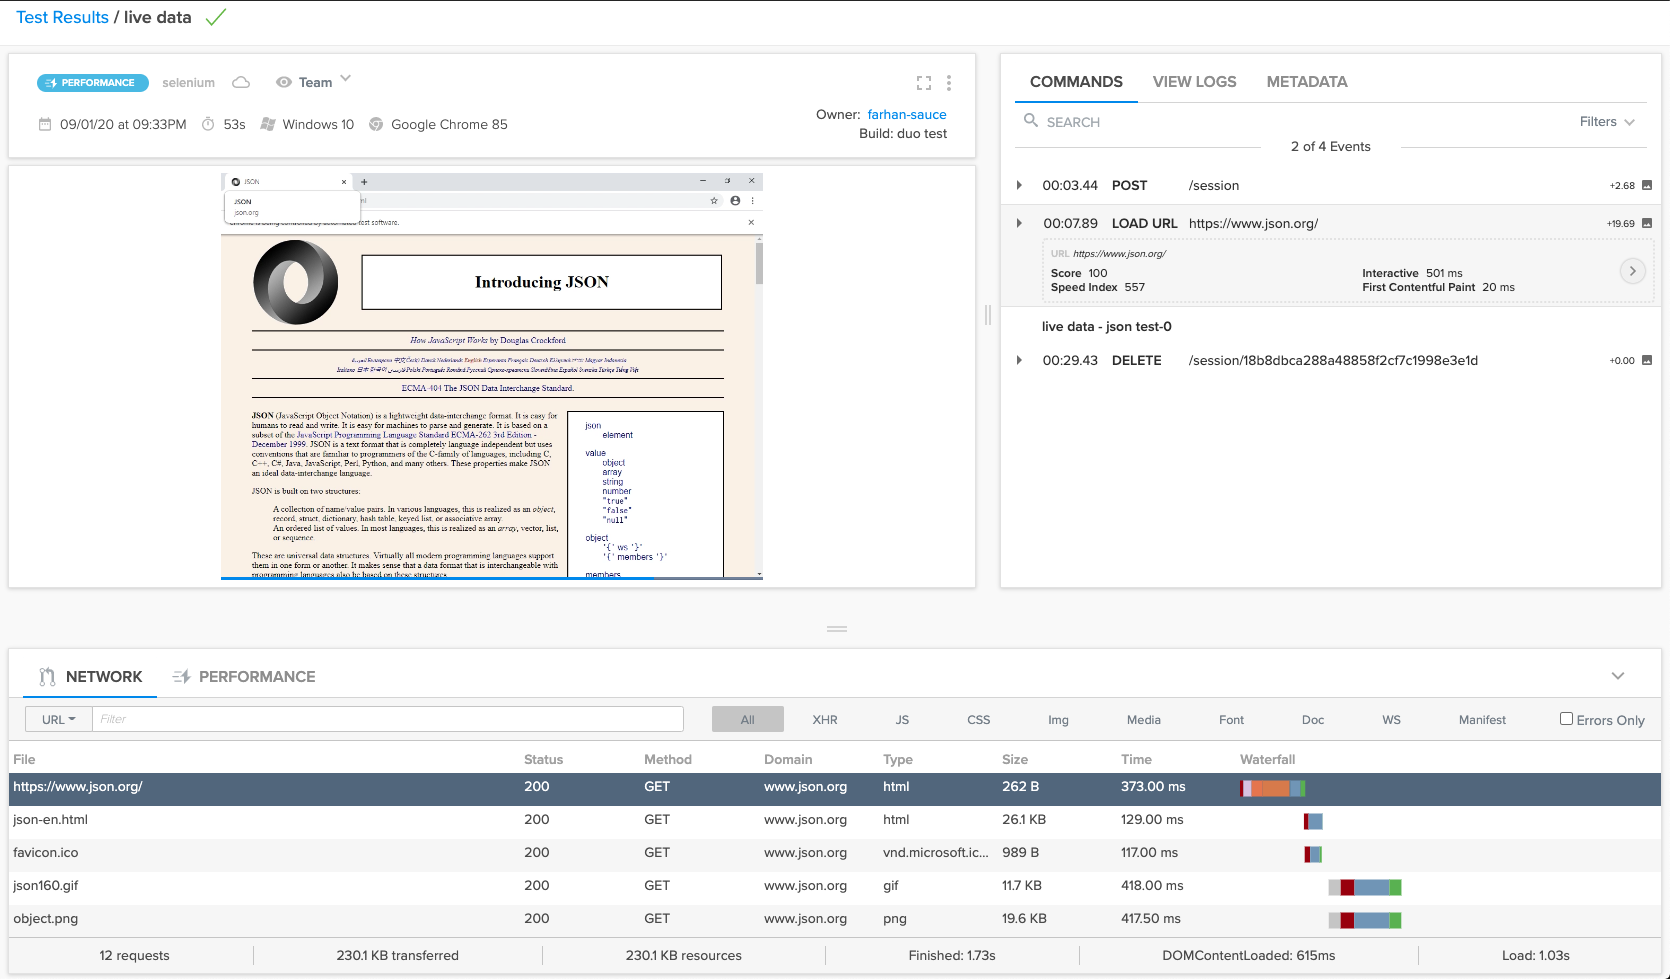
Sync the waterfall chart with video and Selenium command
This feature can be seen using the extended debugging capability with WebDriver tests in Chrome or Firefox browser in Sauce Labs. It highlights the requests on the basis of the timeline of the test video or WebDriver command. This feature is helpful when automating a test that contains multiple URL changes or XHR requests on some event change through WebDriver commands.
Network Viewer components
Network Viewer contains four components:
Filters
This component provides the following functionality.
- Search requests by URL or body/content.
- Filter by file type, available options are XHR, JS, CSS, Img, Media, Font, Docs, WS, Manifest.
- Filter by Error to filter records which have error response or status code that are greater than 400.
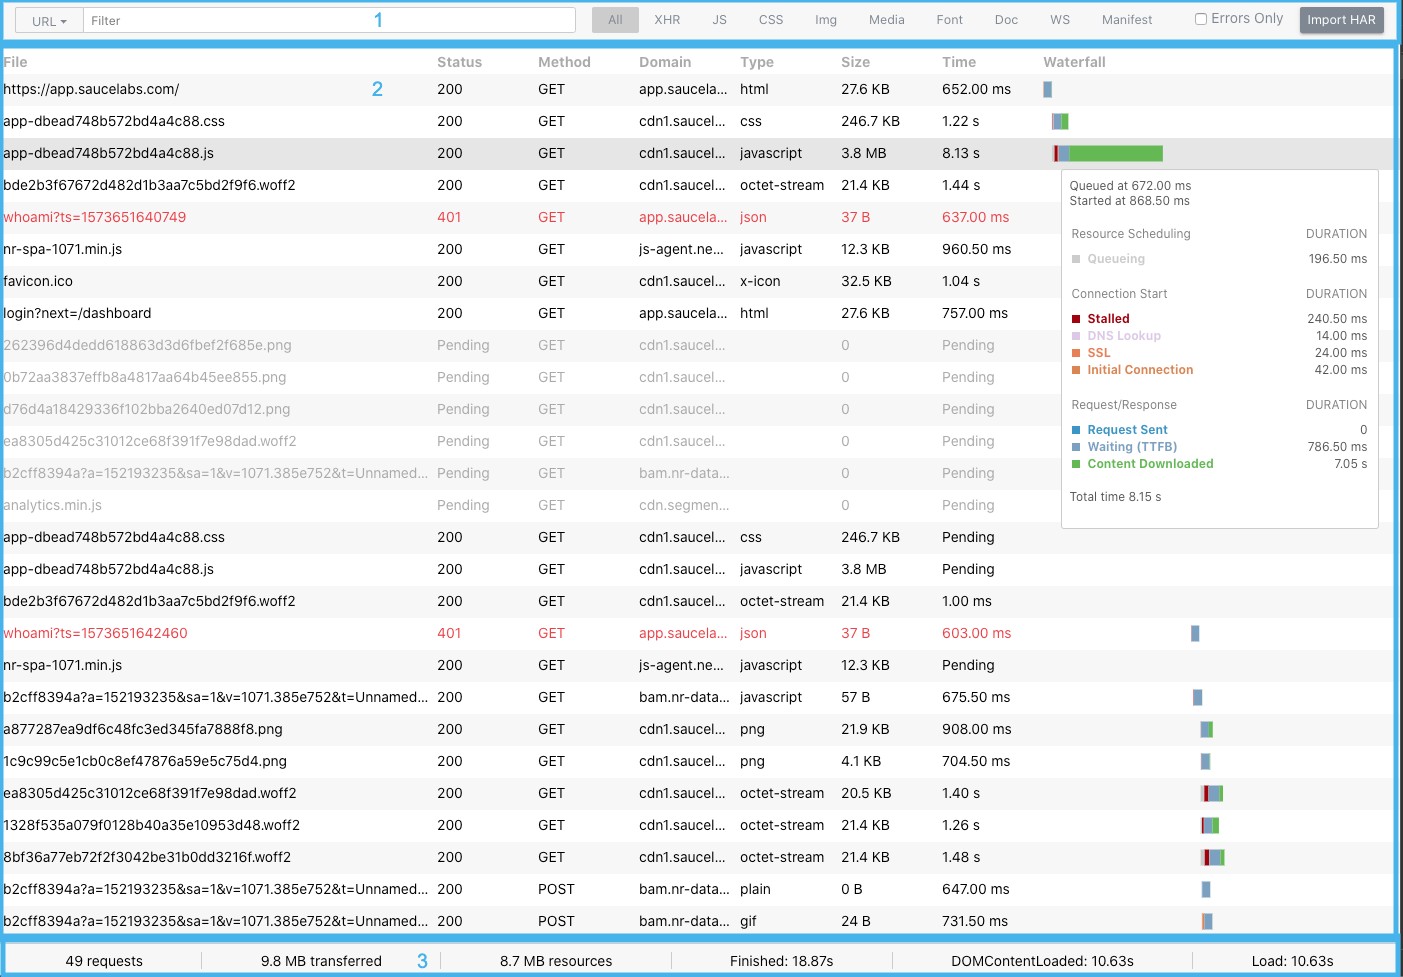
Requests table
This table renders all the requests from the imported HAR file. The following columns are supported:
- File: a name of the request, hover over it to view the full resource with a domain name
- Status: a HTTP status code
- Method: a HTTP method
- Domain: a domain of the request
- Type: MIME type of the requested resource
- Size: the combined size of the response headers plus the response body, as delivered by the server
- Time: the total duration, from the start of the request to the receipt of the final byte in the response
- Waterfall: the timeline column displays a visual waterfall of all network requests
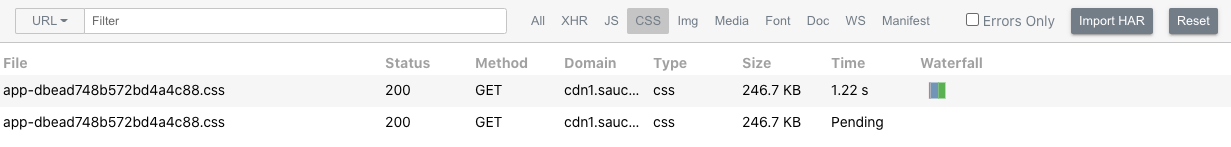
The requests are colored depending on their type. A red entry shows requests with status code greater than or equal 400, which indicates an error. Light grey ones are pending requests which are not completed by the time a HAR file was recorded.
The waterfall view shows the request lifecycle with the following information:
- Stalled: time a request spent waiting before it could be sent. This includes any time spent in proxy negotiation or when waiting for an established connection to become available for reuse
- DNS lookup: time spent performing the DNS lookup
- Initial connection/connecting: time it took to establish a connection
- SSL: time spent completing an SSL handshake
- Request sent/sending: time spent issuing the network request
- Waiting (TTFB): time spent waiting for the initial response, also known as the Time To First Byte
- Content downloaded: time spent receiving the response data.
Stats
At a glance, this component tells you the total number of requests, amount of data transferred, Dom content load time and load time.
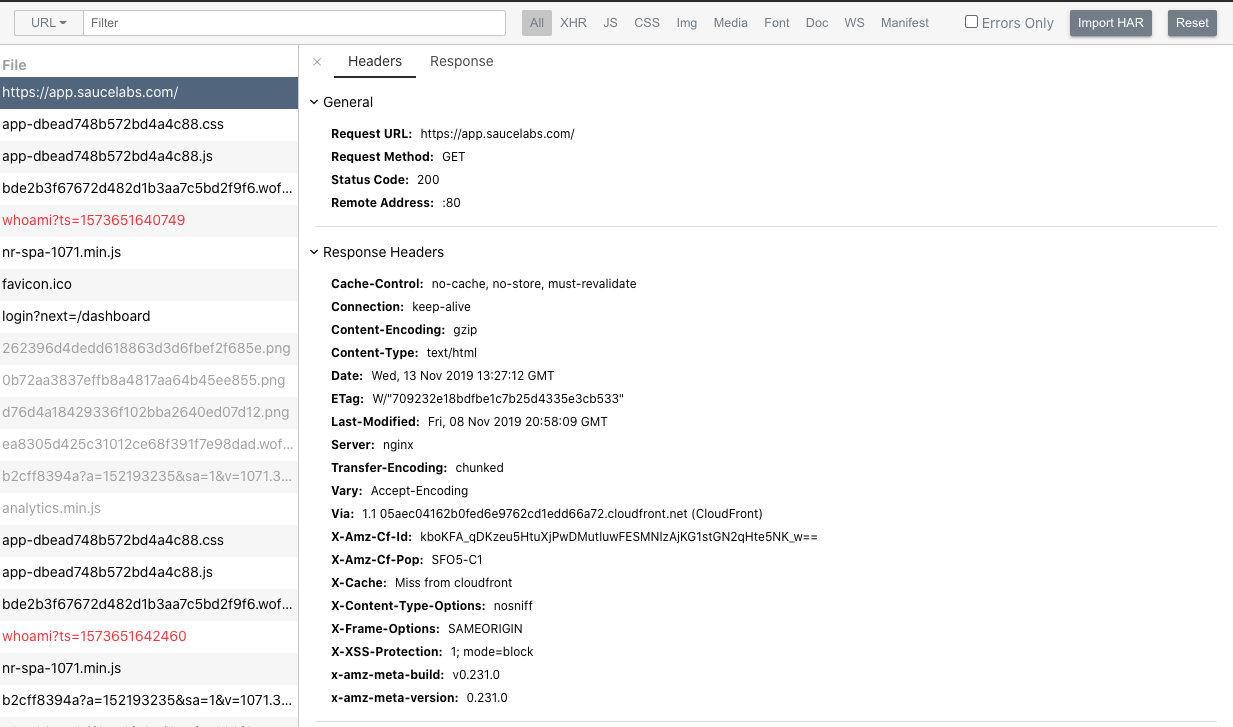
Request Detail View
By clicking on a request, you can view the request detail component. It has two tabs: Headers and Response.
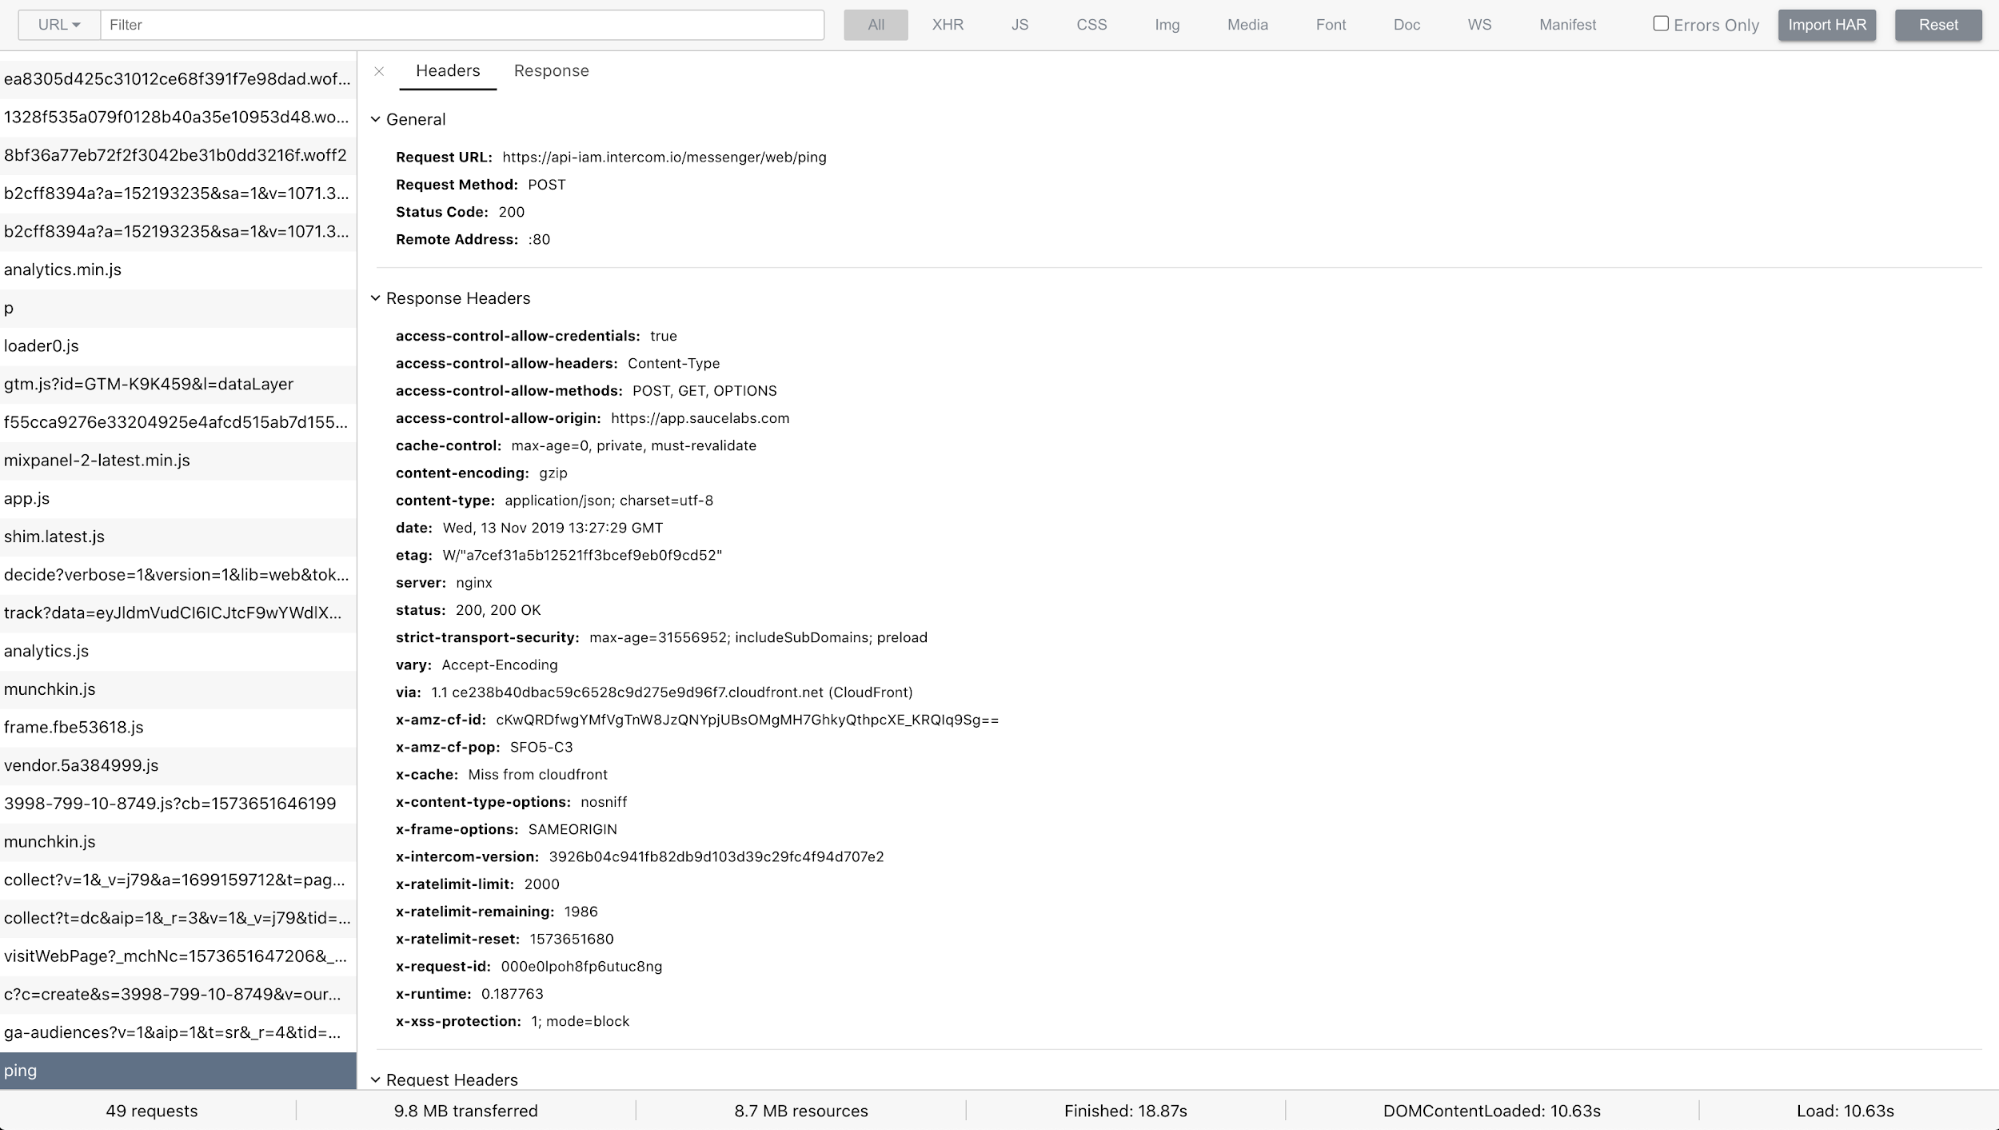
Headers Tab
- A general information section which renders request url, domain, status code, method type, remote address
- Request headers section to display the header information while requesting for the resource, for instance: content-type, origin, user-agent, cookies, authorization
- Response headers section to display the header information which is returned by the server
- Form Data is a list of decoded payload data
- Query String Data is a list of decoded query string params
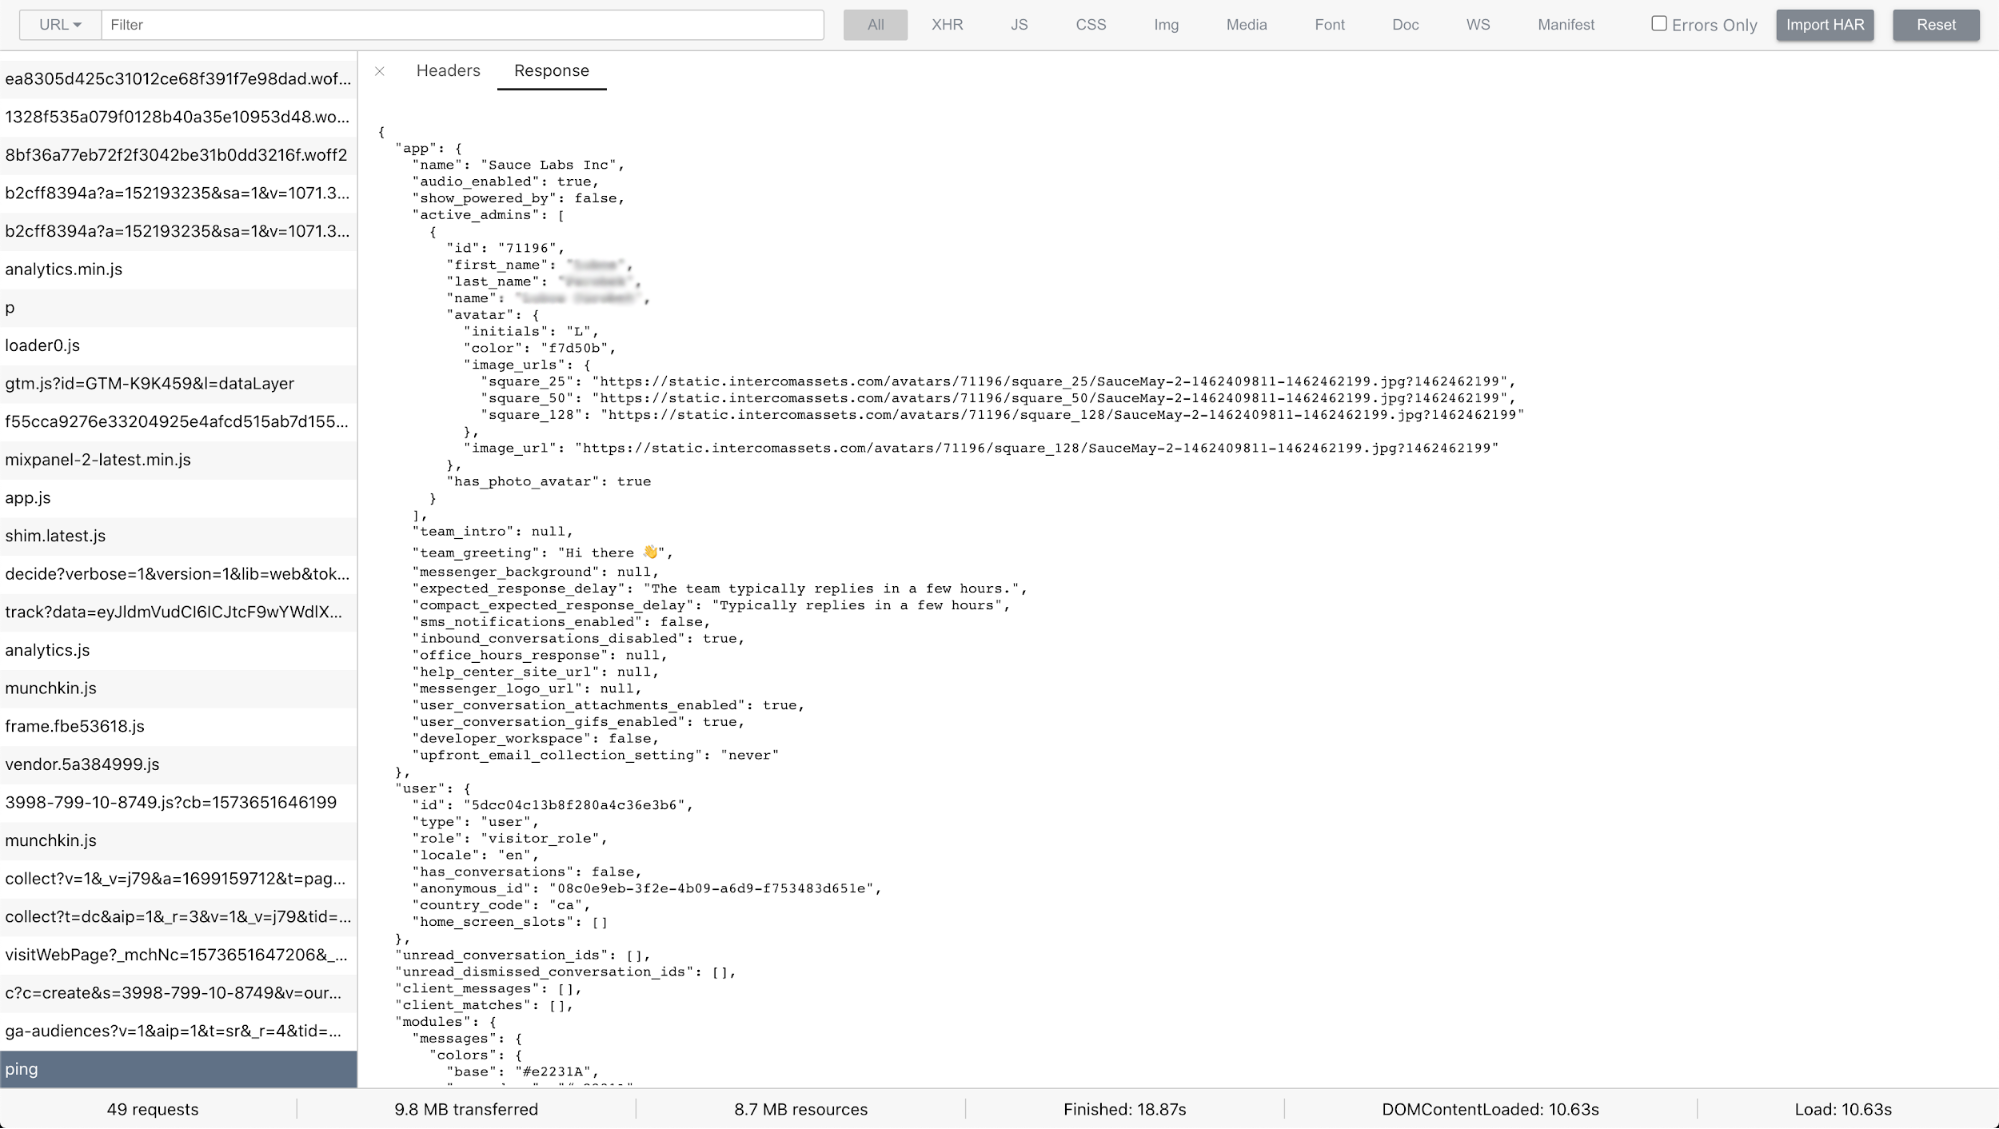
Response Tab
Displays the response of the request. Network Viewer supports JSON and XML format at the moment.
How to use
The Network Viewer is integrated within the Sauce Labs Test Details page. Use extendedDebugging capability to enable HAR capturing within your automated tests. It is supported for Chrome and Firefox at the moment.
As a library
It can be used as a React library for your projects. Check the GitHub repository for more details.
As a web application
We have deployed the web application on https://opensource.saucelabs.com/network-viewer for you to play around with. You can set a query parameter file to load a HAR file from a URL. To enable CORS pass isCORSEnabled=true query parameter in the URL
Roadmap
While we have released the library and already use it in our production application, there are several items we would love to work on next:
- Adopt parent application styles by allowing to set styles using props (#53)
- Sort table on click of column header (#54)
- Support HTLM, JS, CSS, image, SVG file types in the response tab of the request details view (#55)
- Store imported local HAR file on cloud (#56)
If you are interested in helping us out and add features to it, we are happy for every pull request being sent our way.